/apps/enel-x-digital-ecosystem/templates/page-service-local

Skip to Content
データ

Circular City:
Open Data Analysis for
Public Administration

Data-driven tools to support city being smart and sustainability

Speak with an expert today to learn how Enel X can help you achieve your energy goals.

This case study is based on a project developed in Enel X Italy.


Open Data is data that can be freely accessed by anyone. Enel X is committed to transforming this data into valuable information that can be used to build a circular city, rather than just information.


As part of this effort, Enel X has launched a new initiative in Italy to provide useful indicators to support the sustainable evolution of cities from data. The indicators, calculated from Open Data collected from public sources and scientifically validated to ensure maximum coverage and consistency across all Italian municipalities, are an effective tool for municipalities to plan urban development based on objective information on infrastructure, mobility, and services.


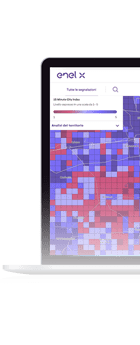
We have also developed City Analytics, a platform for municipalities that integrates and analyzes a vast amount of information (all fully compliant with privacy laws), including not only Open Data, but also connected devices, installed Enel X solutions, and other Big Data.


Using City Analytics, we partnered with HERE Technologies, a digital mapping company, to create Mobility Maps, which were made available free of charge to citizens in Spain, Italy, and Brazil during the Covid-19 pandemic and the recovery phase from the pandemic.

Three City Analytcs indexes

City Analytics

City Analytics is a platform that provides highly accurate information on issues related to the movement of people and vehicles in targeted urban areas. It means that the public administration as well as private companies have the information they need to make the right decisions about public transportation routes, how to accommodate tourists, and how to install infrastructure in the right places for the number of people who want to use it at a particular time. They can identify the causes of traffic jams, take measures to create a smooth traffic flow, and predict future behavior.


An example of how City Analytics was effectively used at the e-Prix in Rome's EUR district was as a means to monitor the number of visitors and the flow of traffic into a particular area, analyze the number of visitors, and estimate where the crowds were coming from. Having visibility into where race spectators came from and how they traveled enabled the city to provide services based on actual demand, organize public transportation more efficiently, and ensure crowd safety.

Mobility Map

City Analytics shone during the pandemic when we used the data to create a dashboard showing the way people’s movements varied in national, regional and municipal areas. The City Analytics Covid-19 – Mobility Map was based on analysis of anonymized and aggregated data from vehicles, maps and navigation systems, and was free to access for citizens wanting to see the effects of the travel containment and social distancing measures adopted in response to the emergency.

mobility map

Awarded by